When will you be able to take a career break? How do you know if you can afford that dream house in three years? Will you have enough money to last your entire lifetime? It’s time to stop guessing or using tools with arbitrary numbers that don’t reflect your real life to find answers to these important questions using financial forecasting.
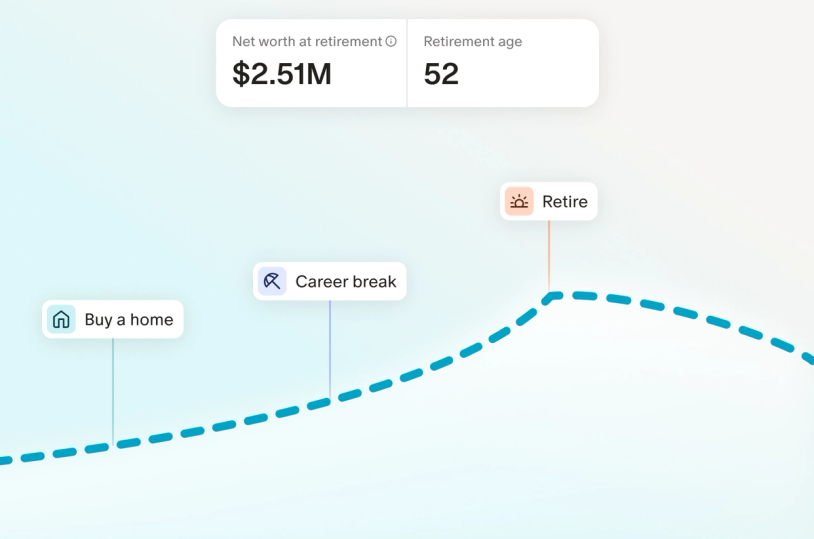
Introducing Forecasting, a new way in Monarch to discover a confident plan for your future. Your existing Monarch data connects to your forecast automatically and we’ve provided you with some common baseline assumptions, so you can instantly begin drawing insights from a forecast. This is a living plan that you can see, test, and trust — and as your life changes, your forecast will, too.

Why we built Monarch’s Forecasting tool
Finally, a forward-looking view
With Monarch, you can already see where your money is and where it's been. Forecasting shows you where it might be going and how major life events could affect your plan.
Goals help you plan and save toward specific targets. Forecasting connects those targets to each other and to the rest of your financial life, so you can see how they interact over time, especially when they affect each other.
Forecasts in Monarch are modeled projections of your finances across decades. Your initial forecast is built on default assumptions drawn from published financial research, and reviewed by credentialed financial experts with decades of real client experience. Every assumption is adjustable.
Major financial decisions — when to retire, whether you can afford the house, how starting a family will affect your finances — shouldn't require guesswork. Now they don't have to.
How Monarch’s Forecasting tool works
Answers on arrival & as life changes
Monarch’s Forecasting tool incorporates your real life data into long-term projections. You won’t spend time guessing what assumptions to make and if they are even close to ballpark accurate (i.e. income, spending, inflation, return rates, life event timing, etc.). This post will dive into the details of how and why we arrived at our default assumptions, which all come from deeply researched data.

You also won’t have to wonder if all the information plugged into the forecast is stale or outdated – Monarch gives you a living forecast that updates in real-time thanks to your linked accounts. This isn’t a static “moment in time” projection. Whenever something changes in an account you’re currently tracking with Monarch, you’ll see that automatically reflected in your forecast.
Play with your future
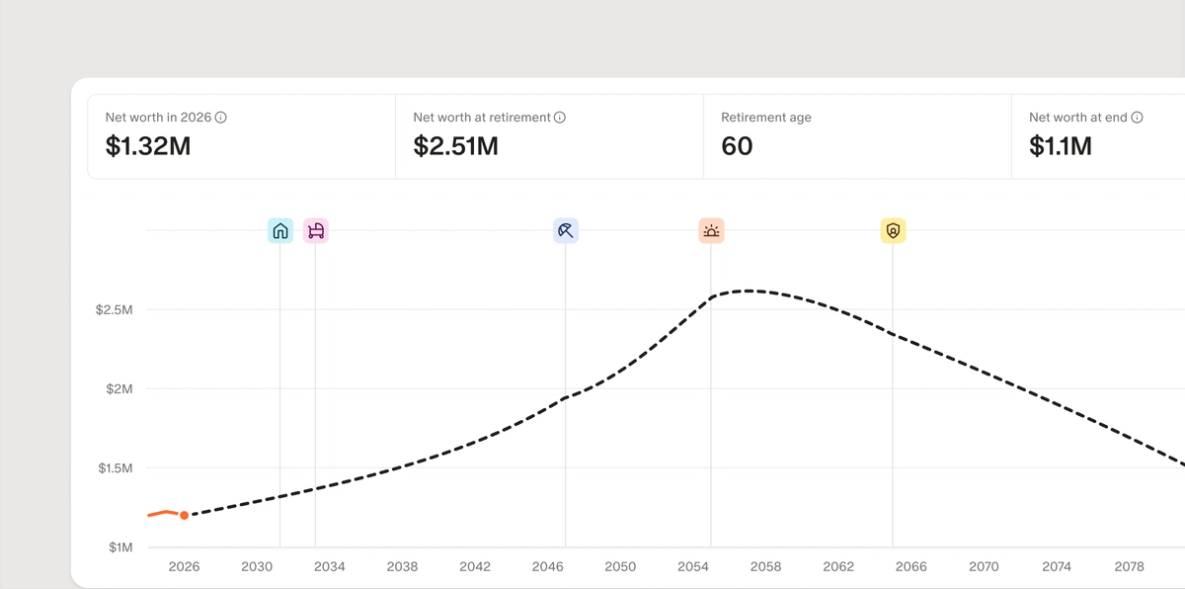
Monarch’s Forecasting tool lets you take a peek into what’s possible, with interactive features baked in along the way. While we give you a headstart by making several default assumptions, this tool is meant to be played with. You can tweak any variable and get instant feedback on how it may impact your financial future.
Want to see how changing your retirement age from 65 to 55 might affect the rest of your life? Want to buy a home in five years, but aren’t sure what price to pay? Experiment with different numbers and see how it plays out. Just click and drag to change any assumption or variable and you’ll instantly see it reflected in the forecast. There is no one right or wrong answer here, no single “best” plan for your financial life – just the trade-offs you are comfortable making in order to live the kind of life that fulfills your values.

Monarch’s Forecasting tool is designed to be explored, not perfected. After all, no matter how precisely you plan your future, life changes quickly and often. This tool is meant to help you move in the right direction and give you the info you need to make more confident decisions for yourself along the way.
Key assumptions behind your Forecast
Most forecasting tools demand extensive data entry: from income to expenses, investment growth, and inflation, it then only delivers a snapshot that's outdated in a moment’s notice.
Other tools leave you guessing the second anything shifts. Monarch is built differently, with flexibility and directional accuracy at its core, based on your real aggregated data.
To get you started without hours of setup, we've made some sensible default assumptions. They're designed to give most people a solid, directionally correct foundation. You can always adjust them to see how they shape your forecast. Let's walk through them.
General assumptions
First, there are general assumptions that tell us basic things like how old you are and what your current net worth is. Leaving the general assumptions as they are without any edits would represent a projection of your current financial trajectory, assuming there are no major discrepancies from your real life or big changes over time. Included are the following:
Household members: We will automatically include anyone you’ve added to your Monarch Household as a member, but you can exclude them from the Forecast if you wish by simply unchecking the box next to their name.
Your age: from your own input or else taken from what you told us in your Monarch Household Members settings.
Take home income per year: This is the average of the last 12 complete months of actual household income from your Monarch data. If we don't have 12 months of data for you, we'll take however many months of data we do have and use them to estimate an average year.
Living expenses per year: The average of the last 12 complete months of actual expenses from your Monarch budget are used as a baseline. If we don't have 12 months of data for you, we'll take however many months of data we do have and use them to estimate an average year.
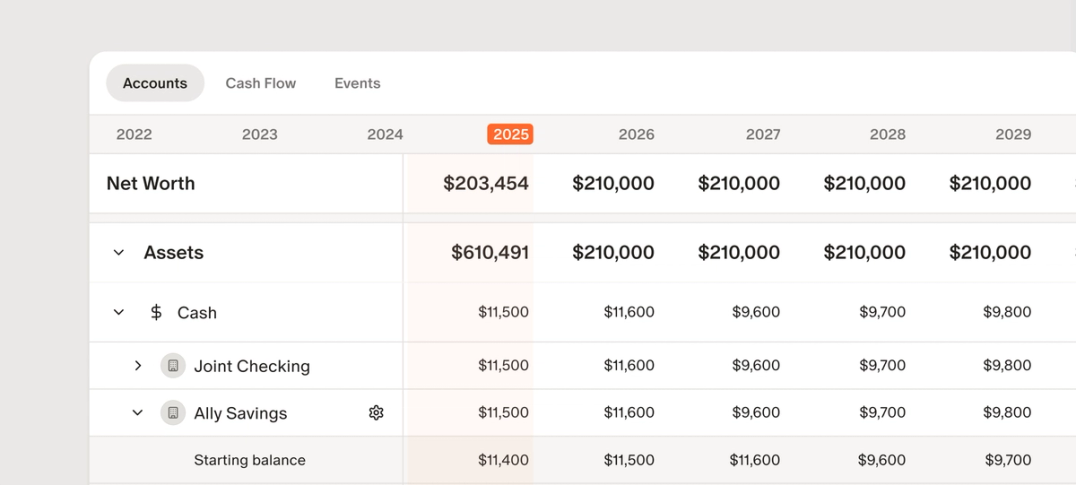
Accounts
Assets: You’ll have a chance to pick which assets you’d like to include in your Forecast while setting it up. All of the financial assets enabled in your Monarch net worth report are included by default, and non-financial assets (cars, homes, etc.) are not. This is because we assume any assets you include in your Forecast could be sold to pay for living expenses during periods when you’re not earning enough income, such as career breaks or retirement. If you wouldn’t sell it to pay for expenses, don’t include it in the Forecast tool.
Liabilities: All debt accounts that are “enabled” in your Monarch Goals Paydown tab are included by default, but you’ll have the chance to include any other debt accounts in your Forecast while setting it up, even if you’re not actively working on paying them down more quickly. Make sure to only include credit cards that you are NOT paying in full every month. We also bring over any info you’ve given us about the interest rates and planned monthly payments (or minimum monthly payments, if planned is blank) for each of the enabled debt accounts. If you update those values in the Paydown tab, we’ll also apply the changes to your forecast unless you manually override those values in your forecasting options.
Current income sources
While setting up your forecast for the first time, we’ll prompt you to tell us your current income sources. We’ll start you off with an estimate of total household take-home income over the past 12 months split evenly between all the members of the household, but be sure to update these figures if they don’t match your reality or remove income sources that you don’t want to rely on for your forecast. Make sure that you’re entering net income only, meaning income after taxes and deductions.
If you have variable income, use a rough estimate of how much net income you expect to make per year, on average, at a minimum. It’s better to underestimate your income and have more than you expected than to overestimate and not have enough.
If you’re a business owner and you pay taxes or business expenses out of pocket, you can either leave those in your income and include them in your living expenses, or exclude them from both income and expenses.
Yearly Inflation and Investment Growth Rates
Based on historical averages and forward projection research, Monarch defaults to the following growth rates on each type of asset, but you can adjust any of them if you wish:
- Savings: 3%. The savings rate is based on expert projections for the average interest rate on cash savings in the US over the next 10 years, which is about 3%.
- Investments: 7%. The investment rate of growth is based on a projection of what financial experts think will happen to a diversified portfolio of stocks and bonds over the next 10 years, otherwise known as a forward projection.
- Real estate: 3%. The real estate growth rate is conservatively based on the inflation rate, since the primary purpose for most owners of real estate is housing, not investment growth.
- Extra savings: 3%. If you don’t tell us where you want them to go, extra savings will grow at the rate for Savings accounts. Otherwise, you can tell us specifically what accounts you want the extra savings to go into and they will grow accordingly.
- Vehicles: -15%. This represents the average decrease in value of most passenger vehicles per year, but you can change it to reflect your own estimates if you prefer.
- Anything else: Defaulted to 3% historical inflation rate.
Inflation rate: The default inflation rate is 3%. This is based on the historical long-term average rate of inflation. We assume throughout the forecast projections that your income and expenses are growing by the rate of inflation.
How did we get to 3% inflation, 7% rate of return for investments, and 3% growth of expenses? It’s all based on research and historical data. According to the Federal Reserve, over the last century, inflation has averaged about 3% -- and yes, the past five years have brought the average inflation rate back from 1-2% per year in the 2000s and 2010s to the 3% per year long-term historical average, so they fit with our expectations. The 7% rate of return for investments is based on what experts expect over the next 10 years for returns on a diversified portfolio with a mix of stocks and bonds.
These assumptions are not set in stone. If you want to see how increased inflation might affect your long term plans, you can change this variable to a higher number. If you want to be a bit more aggressive in your investment strategy and model out what a 9% rate of return will do, you can tweak that as well. All the variables are based on real data, but can be amended to your preferences.
Anticipated life events
There are several common life events and milestones that you can add to your forecast at any time. We also made default assumptions for these life events as well, but members can change them to fit their needs. A few life events we’ve included are buying a home, having a kid, retiring, Social Security, and general expense and income events that can be customized to your life. We have even more pre-built life events coming soon!
Here’s what we’ve assumed for each:
Have a Kid
Deciding whether to have a child through childbirth or adoption is not only extremely personal, but often out of our control. Monarch has made the following default assumptions:
- Years of child expenses: defaults to 13 years to reflect that the majority of child expenses are related to childcare, which tend to only apply for the first part of a child’s life. You can and should adjust this.
- Yearly child expenses: defaults to $18,000, which is based on national averages, but you should adjust this number according to your childcare plans and any other ongoing expenses, including education, food, clothing, healthcare, kid activities, etc.
- Upfront child costs: defaults to $4,500. These are one-time costs related to childbirth, adoption, fertility treatments, family leave, or other set up expenses incurred only in the first year of the child’s life, and are based on national averages. You should update this to reflect your specific situation and include things such as adoption or fertility treatment costs, other costs that aren’t covered by insurance, furnishings, clothing, accessories, etc.
End of Plan
It’s not something most people like to think about, but planning all the way to the end of your life can help you understand if your money is going to last long enough. Monarch makes the following default assumptions:
- Life expectancy is age 90. This age is based on the upper end of US life expectancy and is purposefully more conservative than average life expectancy to make sure that you don’t run out of money if you live longer. You should adjust this based on your own family history.
Social Security
For Social Security income, we’ve made the following assumptions:
- Begin taking Social Security at age 65.
- The age you can start collecting your full Social Security retirement benefit is 67 years old for most people in the US, depending on your date of birth, but you can start taking retirement benefits as early as age 62 or as late as age 70. On average, most people start taking benefits around age 65 so we’ve set this as the default, but you should adjust to reflect your desired starting age.
- Default benefit amount of $2,000 per month.
- This amount is based on the current national average and is updated annually in January, but we link out to the Social Security Administration calculator so you can get a more accurate estimate for your own situation.
Retirement
Everyone should anticipate they’ll no longer be able to work at some point. What retirement looks like and how much paid work you might do during it is a personal decision and the choices are wide ranging, so Monarch made the following assumptions:
- We’ll create a retirement event for each household member you select to include in the Forecasting tool.
- Default retirement age of 65 years old. This is roughly the average age of retirement in the US, but you should play around with it to see what’s possible for you.
- Living expenses: defaults to assume that expenses at retirement remain the same as current spending, adjusted for inflation. Most people don’t want to have to dramatically reduce their lifestyle upon retirement. You can change your spending in retirement with our simple sliding scale if you anticipate spending more or less after you stop working than you spend now.
- Additional yearly expenses: defaults to $6,500 based on average out-of-pocket healthcare expenses for those age 65 and older. You should update this to include anything else you’d specifically want to spend on during retirement, unless it’s already included by adjusting your spending slider to spend more during retirement.
- Income reduction: 100%. Monarch’s default assumption is that all of your income will stop when you retire. You can change this setting if you plan to work part-time or if your partner will continue to work.
Other Life Events
There may be other life events you are planning for that aren’t included among the ones listed above. We plan to keep expanding our event type library to give you quick ways to add common life events, but in the meantime, you can use the “Expense” event to model out scenarios like buying a car, starting a business, saving for a wedding, or paying for education. You can use an “Income” event to model out scenarios like an inheritance, bonus, or new job.
For these event types, we default to a one-time Expense or Income event, but you’re welcome to use the recurring type instead if it’s something that will happen more than once.
- Use a one-time Expense event for things like a wedding, replacing a car, a once-in-a-lifetime vacation, a boat or RV, or other big one-off costs.
- Use a one-time Income event for things like getting a windfall from an inheritance, bonus, company buyout, or tax refund.
- Use a recurring Expense event for things like big vacations you take every year (that aren’t already included in your regular expenses), starting a business (which often aren’t profitable until the second or third year), or paying for education.
- Use a recurring Income event for things like starting a new job that pays more than your current income or annual distributions from a trust that start in the future.
Buy a Home
Based on historical averages and in-depth research, Monarch has chosen the following default assumptions for buying a home:
- Finance vs. Pay Cash: We default the setting to Finance a home purchase, since that’s what the vast majority of home buyers use, but if you’re planning to buy a property outright, you can choose the Pay Cash option instead.
- Down payment amount: defaults to 20% of purchase price. Monarch uses 20% as the default down payment since it is the amount required to avoid private mortgage insurance (PMI) on most mortgages. PMI is an additional expense that may be required if you put down less than 20% on a home purchase.
- It may be helpful to know that the average down payment for first time home buyers in the US is more like 5-10%. The more you put towards a down payment, the lower your monthly payments on a loan will be. Just be sure to leave 2-3 months of expenses or more in savings for emergencies, which you have a higher risk of once you purchase a property.
- Mortgage: Standard 30 year conventional loan. This is what most home buyers in the US use to purchase a property. You can change this to a 15 year mortgage if that’s what you’ll be using instead.
- Mortgage interest rate: 6.5%. This is based on the previous 52-week average rate of a 30 year conventional loan for a single family home and is updated annually in January, but you can change it if rates have changed.
- Property taxes: 1% of purchase price. This is roughly based on the national average but varies greatly depending on your location, so be sure to adjust it to the area in which you are buying a home.
- Home insurance: 0.5% of purchase price. This is roughly based on the national average but again can vary greatly depending on location, so be sure to adjust as needed.
- Yearly home ownership costs: 1% of home value. Homes require ongoing maintenance and occasional repairs. As a general guideline, we recommend setting aside 1% of the value of your primary home each year to account for this. If the property will be rented out to others, you may need to set aside more like 2-4% of the home’s value per year.
- Replace existing Housing expenses: off. We don’t assume you’ll be replacing current monthly housing costs, but if you will be, turn this on and enter your current monthly payment here. For renters, this is the amount you would be spending on rent plus renter’s insurance. For homeowners, this amount should be the monthly amount you would spend on mortgage principal and interest, property taxes, and home insurance.
If you will be selling a home in order to buy a new one, you can add a corresponding Income event in the same year with the net amount you will make in profits from selling your home. This would be the selling price minus any fees to sell, mortgage payoff amounts, home equity loan or HELOC payoff amounts, and any other liens on your property that need to be repaid, such as past-due property taxes or solar panel loans.
Career Break
There’s really no standard for when and how long a person takes a career break. For some folks, a career break is more about taking a lower-paying job for a season with more time off and flexibility. For others, it’s a complete sabbatical with no income for a period. For that reason, you will input the following information for yourself:
- Event owner: defaults to the current user, but you can change this to any other household member.
- Start year: the start year is when you will begin your career break. We’ll assume you start your time off at the very beginning of the year that you select.
- End year: the end year is when you will end your break and return to work. We’ll assume you return to work at the very beginning of the year selected.
- Living expenses: defaulted to stay the same. Monarch makes the assumption your expenses will remain the same during a career break. If you plan to spend more or less, you can easily tweak this variable using the slider.
- Income reduction: 100% reduced. If you plan on taking a career break, Monarch’s default setting is a complete reduction in event owner’s income. If you will have part-time or just lower income, you can adjust this setting.
- This reduction will only apply to the income for the person taking the career break. If you have another household member, their income will not be affected by this event.
- If you are not going to take a full year break, you can set the start and end years to show one year of a break, then adjust the income reduction to reflect how much of the year you’ll be taking off. For example, if you’ll be taking 3 months off, you can set the income reduction to 25%. For 6 months off, set it to 50%.
Expense Withdrawal Order
When the Forecast projects that your expenses will be more than your income in a given year, it needs to pull money from somewhere. The order in which it draws down your accounts isn't arbitrary. It follows the logic our expert financial planners would use to protect as much of your wealth as possible over time. The order can be adjusted to your preferences, but we’d suggest leaving it as follows:
- Extra savings
- Cash accounts
- Taxable brokerage accounts
- Tax-deferred accounts (traditional IRA, 401(k), 403(b), 457, etc.)
- Roth accounts (Roth IRA, Roth 401(k))
- Tax-free accounts (HSAs, 529 plans)
The sequence moves from least tax-advantaged to most: cash first (including extra savings not allocated to other accounts that you may build up from years where your income exceeds your expenses), then taxable brokerage accounts, then tax-deferred retirement accounts like traditional IRAs and 401(k)s, then Roth accounts, and finally tax-free accounts like HSAs and 529s.
The goal is to keep the accounts with the biggest tax advantages compounding for as long as possible while first spending down the accounts where tax advantages are weakest. Monarch applies this automatically so the forecast you're looking at reflects what a thoughtful drawdown strategy would actually look like, but you are welcome to change the order at any time to reflect your situation and preferences.
Extra savings
When your income exceeds your savings, investments, and expenses in a given forecasted year, the surplus is considered to be “extra savings” and needs somewhere to go. We assume as a default that they will go into a savings account earning a little bit of interest. You have the option to split these extra savings into your specific savings accounts or to have them go into investment accounts if you prefer.
Some folks may want to increase their ongoing or one-time expenses instead if they know they are unlikely to set aside unspent money in real life. Just remember: the more realistic you are with yourself about your own habits, the more realistic your forecast will be.
Paycheck contributions
Since Monarch mainly gets net (after taxes and deductions) aka take-home pay information from your bank account transaction history, we could be missing some very important info on contributions you are making to accounts through your paycheck. You can add these in for any retirement account to which you are contributing regularly by going to the account in the list of Assets under Net Worth, then clicking on the gear icon to change the account settings.
These are the default settings for paycheck contributions:
- Yearly paycheck contribution: blank. You should add in any contributions you are doing directly from your paycheck since Monarch doesn’t yet capture those in your transactions. Enter this as a dollar amount. You can play around with the amount of the contributions to see how they affect your forecast.
- Contribution growth rate for accounts: 3%, taken directly from the inflation rate. We assume that your contributions will not be static over time but will grow with inflation. This is not currently adjustable per account.
Taxes
One very impactful but difficult to estimate part of personal finance is taxes. We don’t know exactly where tax rates will land in a couple of years, much less in 30 or more years, and even small changes in tax rates could have big impacts on your finances in the long term. Also, taxes can be complicated with many layers to consider, especially as your finances get more complex. For our initial release of this tool, we’ve decided to work with high level historical averages and current info, then estimate conservatively, in order to give you results that still help lead you in the right direction without getting too far into the weeds. With that in mind, Monarch made the following default assumptions for tax rates in our Forecasting tool:
- Taxable accounts (such as brokerage and savings accounts):
- Capital gains rate: 15% tax on profits made from selling an investment. You can adjust this to 0% if you’re in the lowest income tax bracket or 20% if you’re in the highest tax brackets.
- Taxable portion of withdrawals: 80% of each withdrawal taken from a taxable account will be considered profits from selling investments and will be taxed at the capital gains tax rate. To get this closer to your own actual percentage, add up the amount of profits you’d make on all your investments in taxable accounts if you sold everything right now and divide it by the total value of all your taxable account investments, then enter that percentage in this field.
- Retirement or tax-deferred accounts (such as IRAs, 401(k)s, and 529 plans):
- Income tax rate during retirement: 20% on any income considered to be taxable, including withdrawals from pre-tax accounts or tax-deferred accounts. Adjust this if you think your tax rate on income during retirement will be different
We’re taking a somewhat conservative approach as it relates to taxes, because if our default assumptions aren’t applicable to your situation, we’d prefer it to result in you having more money rather than less. We chose a 15% rate for capital gains because that’s what the vast majority of folks in the US pay right now for this kind of tax.
For withdrawals coming out of taxable accounts, we assume that 80% of any amounts you take came from profits made from selling investments. This is a pretty cautious guess, since we don’t know exactly how much profit you started out with in your accounts (yet - that information, called “cost basis” on your investments, will be integrated in the future!). This percentage could be a lot lower for you if you just bought an investment recently and it hasn’t grown much, or it could be a little higher if almost all the value of your investment is from its growth.
Lastly, the 20% tax rate during retirement is the national average. Your own tax rate might be lower or higher. For any of these rates, you can and should adjust them to your specific situation, but the defaults are meant to give a sense of what is likely for the majority of Monarch members.
Since we are working with net (after tax and paycheck deductions) information in your transaction history and aren’t making specific recommendations for investments, Roth conversions, or Roth vs. traditional (pre-tax) account contributions, we don’t yet calculate your current income tax rate in this tool.
How to Think About Assumptions
The forecasting tool is built on defaults, but your life isn’t average. The defaults are grounded in well-researched historical data, future projections, and best practices, which are a reasonable starting point but may not be exactly true for you. If you live in a higher cost of living area, know what your exact Social Security benefit will be, plan to retire at 62 instead of 65, or something else different from where we start you, be sure to update your inputs. After all, the more your assumptions match your actual situation, the more useful your results will be.
On the other hand, if you’re unsure of when you’d like to retire, start a family, or buy a home, the forecasting tool is an easy way to play around with these scenarios. Change a variable and you’ll see instantly how your hypothetical choices will impact your long-term finances, before you make a real life decision.
There’s no way to know how your life will play out over several decades, even if you’re mostly certain about what you want, and small input changes can create big swings. Changing the rate of return on investments from 7% to 8% or 6% can dramatically change your net worth when you have many years left in your plan. The same goes for inflation or tax rates. This is why Monarch doesn’t currently provide statistical probabilities or speak in absolutes. Because we work with your real time data, it’s best to take the results of a forecast from this tool and use them to determine if you are generally on the right track or if you need to make some broader changes in your strategy. The goal isn’t a precise prediction, it’s a clear direction to head in.
Monarch’s Forecasting was built for ease of use, but under the hood, it’s sophisticated in its methodology. Our team of engineers, designers, product managers, and financial experts are proud of their collaboration to make Forecasting a trusted tool you can use to play with your future.
What Monarch Features are Next?
This is just the first version of Forecasting. Expect more and frequent updates soon. In the short term, we'll be focusing on scenarios, additional event types, and more. Stay tuned!
FAQs
How can I use Monarch’s Forecasting tool?
Monarch’s Forecasting tool is a Plus feature that was created to help you see what’s possible in your financial future. It is designed to evolve and change along with your life. Major life decisions such as buying a home or retiring have massive financial implications. You can use Forecasting to see how those decisions affect your long-term net worth and cash flow depending on timing and inputs. The Forecasting feature isn’t a crystal ball, but instead should be used as a guide to make more informed financial decisions.
What is false precision vs directionally correct?
We’d rather be generally right than precisely wrong in forecasting your future finances. False precision refers to the idea that statistical likelihoods, exact cash flows, complex taxation rules, and net worth assumptions are only relevant and accurate in forecasts if your life remains exactly the same. We cannot predict what life will look like next week, much less in a decade. What we can do is send you in the right direction. By forecasting using well-researched assumptions and financial best practices, we can help you get closer to your overall goals. Nothing is for certain in life, so we won’t pretend that it’s possible to determine exact outcomes. Instead, being directionally correct allows for flexibility and pivots as new information comes into play.
Why are goals and forecasting separated?
Financial goals are fixed targets with deadlines. Forecasting is an estimation of what will happen to your finances based on data inputs. Forecasting is meant to be more flexible and change as new information and data becomes available. Goals, like saving for a down payment or retiring by a certain date, are aspirational and have a prescribed strategy in order to achieve them. Forecasting shows you the impact of those decisions. In many ways, they work in tandem and inform one another. For example, you may see your current retirement goal negatively impacts your long-term forecast and you’ll run out of money early. By adjusting your goal, your forecast will also change.
Why did we choose to present it this way visually and make it easy vs. using advanced statistical modeling and presenting a success rate?
There are a couple main reasons for why we chose to build Forecasting in this manner. First, we believe in being directionally correct over precisely wrong. We can take as much data into our calculations as possible, but we can’t account for the inevitable unknowns and surprises of life. Statistical probabilities are only as good as their inputs. For this reason, it’s best to know you’re heading in the right direction and have flexibility to pivot when needed.
Secondly, making features easier to use will encourage you to actually use them! By offering tools that are easy to manipulate, you don’t have to be a seasoned financial planner to understand how your choices will impact your money over the long-term.